Current binocular market reports disagree by more than a factor of two, and the gap cannot be explained by rounding alone. The public pages use different product boundaries, application segments, revenue definitions, forecast assumptions, and levels of methodology disclosure. The useful answer is therefore a source-labeled range, not a synthetic market value. Readers should match the scope of a report to the claim they want to make before citing its number.
Three estimates, one market label
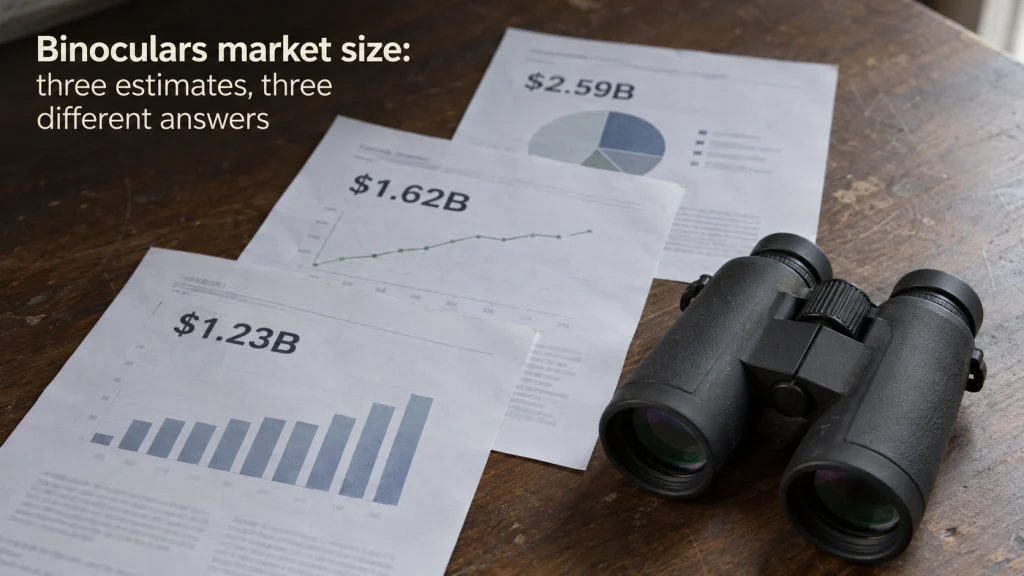
Search for binoculars market size and the first problem is numerical: three current market reports can put the same broadly named category at about $1.23 billion, $1.62 billion, or $2.59 billion. That spread is not a minor difference caused by a decimal place. It is large enough to change how a reader describes the scale of the industry, how fast it appears to be growing, and which forecast seems plausible. Before repeating any one figure, the better question is what each publisher has chosen to count.
I would not average these figures, because an average would create a fourth number with no published methodology behind it. I would also avoid treating the highest estimate as more comprehensive or the lowest estimate as more conservative without checking the scope. The reports divide products and applications differently, and one public description explicitly includes categories and revenue concepts that can broaden the total. That makes this a source-comparison problem before it becomes a forecasting problem.
The reports included and the fields recorded
This comparison uses three current global reports from Fortune Business Insights, 360iResearch, and The Business Research Company as distributed by Research and Markets. I recorded the headline market estimate, the forecast endpoint, the listed compound annual growth rate, the product and application categories visible on the public page, and any methodology or market-value definition available without purchasing the report. Those fields are enough to show why the published numbers should not be treated as interchangeable. They are not enough to reconstruct the proprietary models behind the estimates, which is an important limitation of the exercise.
The reports were selected because all three publicly present a global binoculars market estimate and disclose enough scope information to compare their framing. I did not add extra market reports merely to make the source list longer, because more figures would not fix the underlying comparability problem. The point is to inspect how a small set of current estimates are built and labeled, then preserve the boundaries around what the public pages actually show. Readers looking at product categories themselves can use the site’s guide to different types of binoculars as a separate consumer-facing reference rather than treating a market-research segmentation scheme as a buying taxonomy.
| Publisher | Published market estimate | Forecast endpoint | Listed forecast CAGR | Public scope signal |
|---|---|---|---|---|
| Fortune Business Insights | About $1.23 billion | About $1.81 billion | 4.93% | Prism type, product type, multiple recreational and professional applications, surveillance, online and offline distribution |
| 360iResearch | About $1.62 billion | About $2.52 billion | 7.55% | Consumer, professional, and other application contexts, including digital features and several non-consumer use categories |
| The Business Research Company | About $2.59 billion | About $2.82 billion | 2.1% | Prism and product segmentation, broad application coverage, factory-gate value definition, and a market description that includes additional optical-device categories |
The table is a ledger of what the public pages say, not a ranking of research quality. A larger number can result from a broader definition, a different revenue basis, a different segmentation model, or a different forecasting method. A faster CAGR can also coexist with a smaller current estimate because growth rate and starting market definition are separate questions. The next step is therefore to compare the structure beneath the figures rather than the figures alone.
Put the published market values on the same comparison line
Fortune Business Insights is the lowest of the three current estimates at about $1.23 billion, followed by 360iResearch at about $1.62 billion, while The Business Research Company is much higher at about $2.59 billion. The gap between the lowest and highest figure is roughly $1.36 billion, which is larger than the entire lowest estimate. That immediately rules out the idea that these are merely slightly different readings of one universally defined consumer market. The values need to remain attached to their publishers and definitions whenever they are quoted.
The forecast endpoints also diverge, but they should not be compared as if they all describe the same time window or the same product basket. Fortune Business Insights publishes an endpoint near $1.81 billion, 360iResearch near $2.52 billion, and The Business Research Company near $2.82 billion. Their listed growth rates differ as well, ranging from 2.1% to 7.55%, which reinforces that the models are not moving in lockstep. A reader can compare the direction and scale of each forecast, but should not splice one publisher’s starting value to another publisher’s growth rate.
| Comparison question | Fortune Business Insights | 360iResearch | The Business Research Company |
|---|---|---|---|
| Current estimate | Lowest of the three | Middle estimate | Highest of the three |
| Forecast growth rate | Moderate | Fastest listed rate | Slowest listed rate |
| Can the number stand alone? | No, scope matters | No, scope matters | No, value definition and scope matter |
That comparison is more useful than declaring a winner because it preserves the relationship between each estimate and its own forecast. It also prevents a common market-research error: treating a visually neat chart as proof that the underlying categories are aligned. If the category boundaries differ, identical units such as U.S. dollars do not make the estimates directly comparable. The safest shorthand is a source-labeled range, followed immediately by the reason the range is wide.
Why the estimates are not measuring the same market
The strongest explanation is scope, not arithmetic. Fortune Business Insights separates roof and Porro prism binoculars, then includes product groups such as image stabilization, night vision, digital or compact, large binoculars, and other products. Its application list stretches across recreational viewing, marine use, sports, travel, bird watching, theater and concerts, and surveillance. That is already broader than the everyday consumer image of a conventional handheld optical binocular.
360iResearch also describes a market spanning consumer and professional contexts, with outdoor recreation, birdwatching, sports viewing, astronomy, industrial inspection, and several non-consumer applications appearing on its public page. The Business Research Company goes further in a way that matters for interpretation because its public market description says the market includes sales of specialized binoculars, monocular and compact binoculars, high-powered binoculars, and related categories. Once one publisher counts a broader set of optical devices or revenue types, its total can rise without implying that conventional consumer binocular sales are dramatically larger. This is why a reader should compare definitions before using the figures in any market narrative.
| Publisher | Product scope visible on the public page | Application scope visible on the public page | Interpretation boundary |
|---|---|---|---|
| Fortune Business Insights | Roof and Porro prism categories plus image stabilization, night vision, digital or compact, large, and other binocular products | Recreational viewing, marine use, sports, travel, bird watching, theater and concerts, surveillance, and other applications | Broader than a narrow daytime consumer-binocular definition |
| 360iResearch | Consumer and professional binocular categories with digital features and other specialized configurations described in the market taxonomy | Outdoor recreation, birdwatching, sports viewing, astronomy, industrial inspection, and several non-consumer contexts | Mixed consumer and professional framing limits direct comparison with consumer-only claims |
| The Business Research Company | Specialized binoculars, monocular and compact binoculars, high-powered binoculars, and related optical-device categories | Broad application coverage across consumer and professional demand categories | Broader product and value framing can lift the total without proving higher conventional retail-binocular revenue |
This matrix makes the comparability problem visible without pretending the public category labels are perfectly standardized. The rows summarize only scope signals disclosed on the public pages, so they should not be read as a reconstruction of each publisher’s proprietary taxonomy. What matters for citation is whether the visible product and application basket fits the claim being made. If it does not, the market total needs a qualification rather than a stronger adjective.
Compare geography and product scope before comparing dollars
All three reports present global coverage, so geography alone does not explain the full spread. The meaningful difference is what sits inside that global basket, especially where digital, night-vision, specialized, professional, or adjacent optical products are included. A report can be global and still be narrower or broader than another global report. For consumer research, the site’s overview of binocular brands and buying context is therefore a better place to understand real shopping choices than a commercial market report’s segment labels.
Compare product and application segmentation
Segmentation tells us what a publisher thinks belongs inside the market, even when the public page does not reveal every calculation. Fortune Business Insights assigns explicit product and application segments that include categories outside ordinary daytime recreational optics. 360iResearch similarly describes a mixed consumer and professional landscape rather than a narrowly defined birding or travel market. The Business Research Company combines broad application coverage with a market description that reaches beyond a strict two-barrel consumer-binocular definition, so its higher total should be read with that scope in view.
Separate the observed estimate from the forecast value
A current market estimate and a forecast endpoint are different kinds of numbers even when they appear in the same chart. The first is the publisher’s estimate of a present or base market, while the second is a modeled outcome that depends on growth assumptions. A fast forecast does not validate the starting estimate, and a large starting estimate does not prove a more complete methodology. Keeping those roles separate makes it harder to accidentally present a forecast as if it were measured sales.
Limit: the public report pages expose enough information to identify major scope differences, but they do not provide the full proprietary data model needed to reconcile the three estimates line by line.
The practical takeaway is simple: quote each figure as a publisher-specific estimate rather than as an objective measurement of one fixed market. If a report’s scope includes non-consumer or adjacent product categories, say that before using the total to describe ordinary retail binocular demand. If the scope is unclear, narrow the claim instead of filling the gap with an assumption. That discipline matters more than choosing the number that looks most impressive.
Record what the public pages do not reveal about methodology
Commercial market-report landing pages are useful evidence, but they are not the same as a fully inspectable dataset. Fortune Business Insights publishes clear headline values, segmentation, regional framing, and a growth rate, yet the public page does not expose the full calculation behind every market-size input. The Business Research Company is unusually helpful in defining market value as factory-gate revenue and explaining that related services sold by creators can be included, but the detailed estimation model remains inside the paid research. A reader should therefore treat the visible number as an estimate produced under the publisher’s framework, not as an audited sales total.
360iResearch creates a different transparency issue because its public page presents headline market-size and forecast figures while its methodology text describes a qualitative research process and says that summary intentionally excludes market sizing, market share estimates, revenue forecasts, and speculative numerical projections. That does not prove the headline numbers are invalid, but it means the public methodology text does not explain the numerical model shown elsewhere on the same page. The correct response is to mark the method as incomplete in public view rather than inventing the missing steps. A source audit becomes more credible when it records unknowns instead of smoothing them over.
- Keep the publisher name attached to every market-size figure.
- Record whether the public page defines market value, revenue basis, or included product categories.
- Separate disclosed segmentation from assumptions about what a segment contains.
- Do not infer proprietary sample sizes, data sources, or model weights when the public page does not provide them.
- Do not combine one report’s estimate with another report’s CAGR to manufacture a new forecast.
These rules are intentionally conservative because commercial forecasts often compress a large modeling process into a short public summary. They also make future updates easier, since a later report can be compared against the same fields instead of against a vague memory of an older headline. If a publisher changes scope or methodology, that change can matter as much as the new dollar figure. The audit should therefore preserve definitions first and numbers second.
Participation data answers a different question
Wildlife watching, hiking, sports attendance, astronomy participation, and other activities can provide context for where binocular demand might come from, but participation counts are not binocular ownership counts. One person can participate without owning binoculars, one household can share a single pair, and another buyer can own several pairs for different uses. Turning an activity-participation statistic into a unit-sales estimate would therefore require assumptions that these market reports do not justify. That is why I did not use a U.S. participation statistic to inflate or validate any of the three global market values.
Participation data becomes useful when the question is narrower, such as whether a viewing activity has a large audience or whether a use case is gaining attention. It can also help explain why publishers include categories such as bird watching, sports viewing, or travel in their segmentation, but it still cannot tell us the revenue captured by binocular manufacturers. The same caution applies to brand visibility and consumer discussion: a popular brand or heavily discussed complaint does not automatically translate into market share. For that separate evidence stream, the site’s analysis of binocular buyer complaints is more appropriate than forcing participation data into a market-size equation.
Why I would quote a range before a single market number
If I needed one sentence for a reader, I would say that current published estimates in this sample span roughly $1.23 billion to $2.59 billion, with materially different scope definitions behind the endpoints. That wording is less tidy than quoting one precise figure, but it is more faithful to the available evidence. It tells the reader that the uncertainty is not just statistical noise and that source choice changes the answer. It also makes room for a follow-up sentence explaining which report is most relevant to the exact question being asked.
A narrower consumer-focused discussion might prefer the report whose categories most closely match conventional retail binoculars, while an industry-wide discussion may intentionally include broader optical, professional, digital, or specialized segments. Neither choice should be hidden. A market-size citation earns its usefulness from fit between the source definition and the claim, not from the number having more decimal places. The same principle applies when comparing how binocular brand lineups are structured, because assortment breadth and market revenue are related questions but not interchangeable measures.
| If the claim is about | Best citation behavior |
|---|---|
| The broad global market | Quote a source-labeled range and disclose major scope differences |
| Conventional consumer binoculars | Use the narrowest clearly relevant scope and avoid broader categories unless explicitly needed |
| Forecast growth | Keep each publisher’s starting estimate, growth rate, and endpoint together |
| Retail demand for a channel or marketplace | Use channel-specific sales or demand evidence instead of a global industry forecast |
The range is therefore not a substitute for analysis. It is a compact way to acknowledge that the public evidence supports multiple defensible estimates under different definitions. Once the reader needs a more specific answer, the scope should narrow with the claim. That is more useful than pretending the category has one universally accepted value.
What this audit cannot tell us about marketplace demand or future sales
None of these three global reports can tell us how many binoculars buyers will purchase through a specific marketplace, retailer, brand, or affiliate site. A global revenue estimate mixes geographies, channels, product definitions, and customer types in ways that do not map cleanly to one storefront. Even a report with an online-versus-offline segment does not provide the search volume, conversion rate, unit velocity, price distribution, or brand mix needed to forecast a particular marketplace. Using the global market number as a shortcut for marketplace demand would create false precision.
The reports also cannot establish future sales for a specific website, product category page, or content strategy. Forecast growth can describe the publisher’s model for the broad market, but traffic, rankings, retailer availability, pricing, consumer intent, and competition can move differently. The right next step for marketplace demand would be marketplace-specific sales evidence or a clearly documented demand dataset, not another global forecast. This audit stops at the point where the public market reports stop being fit for the question.
Final thoughts: keep the number attached to its definition
The three reports do not support one definitive binoculars market size. They support a current published range from about $1.23 billion to $2.59 billion, with different product boundaries, application mixes, value definitions, and levels of methodological transparency behind the figures. The highest estimate is not automatically the best estimate, and the lowest estimate is not automatically the most conservative one. The useful comparison is between source definitions, not just between dollar totals.
For a broad market statement, I would quote the range and name the publishers. For a narrower claim, I would choose the report whose visible scope best matches that claim and state the limitation if the fit is imperfect. Broader mixed categories should not be relabeled as consumer-binocular revenue, and participation statistics should not be treated as ownership data. That keeps the conclusion modest, reproducible, and tied to evidence a reader can inspect.
FAQs
🔍 How big is the global binoculars market?
There is no single figure supported by all current publishers. In this three-report sample, the published estimates span roughly $1.23 billion to $2.59 billion, and the gap reflects meaningful differences in scope and methodology.
📊 Why do binoculars market size reports disagree?
They can include different product categories, applications, revenue definitions, geographies within regional calculations, and forecasting assumptions. The public pages also disclose different levels of methodological detail, so the figures should stay attached to their sources.
🧭 Which binoculars market estimate should I cite?
Use the estimate whose visible scope best matches the claim you are making. If the claim is broad and the scopes remain incompatible, cite a range and explain why the endpoints differ.
🧮 Can I average the published estimates?
No. Averaging figures built from different market definitions creates a new number with no published methodology behind it, so it is less defensible than quoting the source-specific estimates.
🛒 Does global market size show demand on a specific marketplace?
No. Marketplace demand needs channel-specific evidence such as sales, unit velocity, search behavior, pricing, or conversion data rather than a global industry estimate.
References and sources
- Fortune Business Insights binoculars market report: supports the lower current estimate, forecast endpoint, growth rate, and disclosed product and application segmentation used in this comparison.
- 360iResearch binoculars market report: supports the middle current estimate, forecast endpoint, growth rate, scope language, and public methodology observations used in the audit.
- Research and Markets listing for The Business Research Company report: supports the higher current estimate, forecast endpoint, market-value definition, segmentation, and broader category description discussed above.