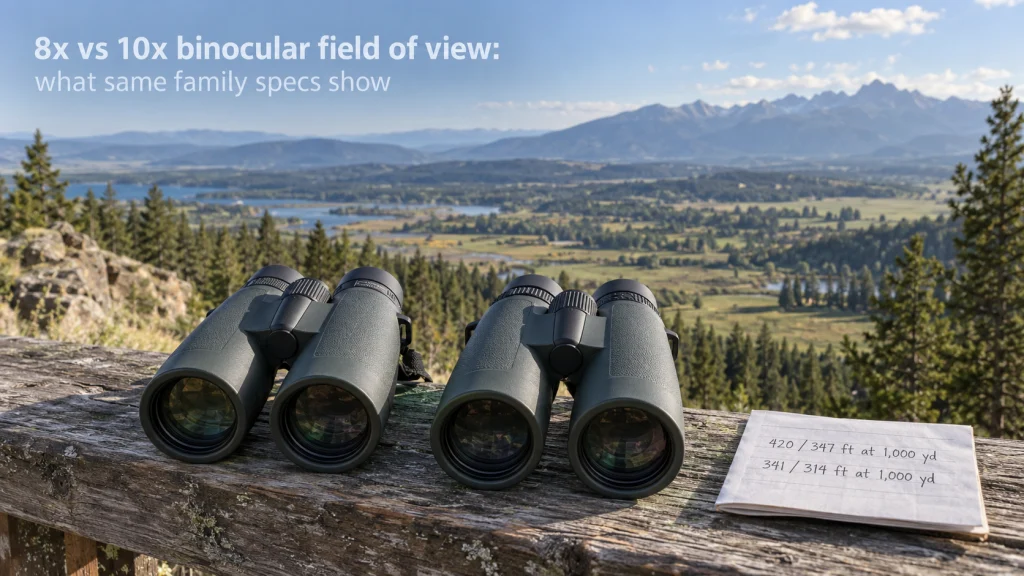
In this 8x vs 10x binocular field of view dataset, four current 8×42 and 10×42 pairs from the same product families show that the narrower 10x view is real but not uniform. The observed loss ranges from about 7.9% to 17.4% when each 10x model is compared with its 8x family mate using manufacturer-published linear field of view. The useful comparison is therefore the exact pair you are considering rather than a market-wide shortcut.
Same family, different field width
Put the Maven B1.2 8×42 and 10×42 side by side on paper and the field widths are 420 and 347 feet at 1,000 yards. That is a 73-foot reduction, or about 17.4% of the 8x field. Now make the same comparison within the Maven C.1 family, where the published figures are 341 and 314 feet at 1,000 yards. The reduction there is only 27 feet, or about 7.9%, even though both comparisons move from 8×42 to 10×42.
That contrast is the point of this dataset. An 8×42 or 10×42 label tells you the magnification and objective diameter, but it does not tell you the complete optical design or the final field width. A 10x version commonly has a narrower real field than its 8x family mate, yet the amount of narrowing depends on the family. Treating 10x as if it automatically removes one fixed slice of the scene skips the part that the specification sheet can actually answer.
Why the sample uses same-family pairs
The sample controls one obvious source of noise by pairing magnifications within the same named family and the same 42 mm objective class. Maven B1.2, Nikon MONARCH M7, Vortex Diamondback HD, and Maven C.1 all publish both an 8×42 and a 10×42 version. That does not make the models optically identical, and it is not supposed to. It gives us a cleaner way to ask how the field changes when a manufacturer offers two nearby magnifications inside one design family.
Cross-brand comparisons can still be useful for shopping, but they mix magnification with many other design choices at once. The same-family method keeps the question narrower and makes the calculation easier to audit against official specifications. I also recorded whether basic dimensions and weight stayed the same because those details help confirm that we are looking at sibling configurations rather than unrelated binoculars with similar labels. For broader context on the fields commonly listed by makers, see the binocular specifications guide before treating any one number as a complete buying verdict.
| Family | 8×42 FOV | 10×42 FOV | Published size relationship | Published weight relationship |
|---|---|---|---|---|
| Maven B1.2 | 420 ft/1000 yd | 347 ft/1000 yd | Same 5.2 x 5.7 x 2.2 in dimensions | Same 26.808 oz |
| Nikon MONARCH M7 | 435 ft/1000 yd | 362 ft/1000 yd | Same 5.6 x 5.1 in length and width | 23.6 oz vs 24.0 oz |
| Vortex Diamondback HD | 393 ft/1000 yd | 330 ft/1000 yd | Same 5.7 in height and 5.1 in width | 21.8 oz vs 21.3 oz |
| Maven C.1 | 341 ft/1000 yd | 314 ft/1000 yd | Same 5 x 5.7 x 2.1 in dimensions | 24.0 oz vs 24.5 oz |
The ledger is not a quality ranking. Shared dimensions do not prove that two magnifications use identical eyepiece designs, and small weight differences do not explain field width by themselves. They simply document the family relationship and prevent the dataset from quietly mixing unlike configurations. The next step is to put every field figure into one unit so the changes can be compared directly.
Normalize every field of view figure to one unit
Manufacturers may publish field of view as degrees, feet at 1,000 yards, meters at 1,000 meters, or more than one of those forms. For this comparison, linear field of view in feet at 1,000 yards is the common unit because all four selected families publish it directly. Using one unit avoids pretending that a degree figure and a linear width are immediately comparable just because both describe field of view. It also keeps the arithmetic tied to numbers a buyer can find on the official product page.
No conversion is needed for the four primary pairs because each maker already supplies the same linear unit. If a future family published only meters at 1,000 meters, that value would need to be converted before entering the dataset rather than mixed into the table as-is. The same discipline matters when reading a binocular specification sheet, where similar-looking labels can use different units or describe real versus apparent field. Normalization is bookkeeping, but without it a clean-looking comparison can be numerically sloppy.
- Use the manufacturer-published real or linear field, not apparent field, for the primary comparison.
- Keep one linear unit across all family pairs before calculating differences.
- Compare 10x against its own 8x family mate, not against the widest 8x in the whole sample.
- Calculate both the absolute loss in feet and the percentage loss from the 8x baseline.
Those rules keep the calculation modest in scope. They do not attempt to infer edge sharpness, usable field, distortion, or how wide the view feels to a particular observer. They only compare the published real field widths that the manufacturers provide. That narrow definition is what makes the next table useful instead of overclaimed.
How much field of view changes from 8x to 10x in each family
The four family pairs do not collapse into one neat reduction. Maven B1.2 and Nikon MONARCH M7 each lose 73 feet at 1,000 yards, but they start from different 8x fields, so their percentage changes are not identical. Vortex Diamondback HD loses 63 feet, while Maven C.1 loses only 27 feet. The raw difference already shows why an 8x-to-10x rule needs more context than the magnification labels provide.
Percentage change makes the starting width part of the calculation. I use the 8x figure as the baseline, subtract the 10x figure, divide that loss by the 8x figure, and multiply by 100. This is not a performance score and does not reward a wider field automatically. It is simply a consistent way to express how much of each family’s published 8x field is no longer present in its 10x version.
| Family | 8×42 FOV | 10×42 FOV | Absolute loss | Percentage loss |
|---|---|---|---|---|
| Maven B1.2 | 420 ft/1000 yd | 347 ft/1000 yd | 73 ft | 17.4% |
| Nikon MONARCH M7 | 435 ft/1000 yd | 362 ft/1000 yd | 73 ft | 16.8% |
| Vortex Diamondback HD | 393 ft/1000 yd | 330 ft/1000 yd | 63 ft | 16.0% |
| Maven C.1 | 341 ft/1000 yd | 314 ft/1000 yd | 27 ft | 7.9% |
| Family | 8x to 10x FOV loss | Relative change |
|---|---|---|
| Maven B1.2 | 17.4% | 17.4 of 20 percentage points |
| Nikon MONARCH M7 | 16.8% | 16.8 of 20 percentage points |
| Vortex Diamondback HD | 16.0% | 16.0 of 20 percentage points |
| Maven C.1 | 7.9% | 7.9 of 20 percentage points |
Read this chart as a comparison of change size, not as a score. B1.2, MONARCH M7, and Diamondback HD cluster near a 16% to 17% reduction, while C.1 sits well below them at 7.9%. That separation is more informative than an average because it preserves the family-by-family variation the sample was designed to measure. The chart also keeps the baseline explicit, with every percentage calculated from that family’s published 8x field.
Calculate the 8x to 10x change family by family
For Maven B1.2, subtracting 347 from 420 gives a 73-foot loss, and 73 divided by 420 produces about 17.4%. For Nikon MONARCH M7, the same 73-foot absolute loss comes from a wider 435-foot starting point, so the percentage is about 16.8%. Vortex Diamondback HD moves from 393 to 330 feet, which is a 63-foot loss and about 16.0%. Maven C.1 moves from 341 to 314 feet, which is a 27-foot loss and about 7.9%.
Compare absolute loss with percentage loss
Absolute loss answers how much scene width disappears at the stated distance, while percentage loss answers how large that change is relative to the 8x starting field. Both are useful because a 73-foot loss does not mean exactly the same thing when one 8x model starts wider than another. Percentage change is especially helpful when comparing families with different baseline fields. Still, neither measure says whether the remaining 10x field is wide enough for your use, because that requires the exact viewing situation and other specifications.
Show the spread instead of one universal number
The observed family-by-family range is about 7.9% to 17.4%, a spread of roughly 9.5 percentage points. Three families in this sample sit near 16% to 17%, while one is much lower, so the distribution matters more than a single average. Maven C.1 is especially useful here because it shows that a same-family 8x-to-10x change can be materially smaller than the other pairs in the sample. Reporting the spread preserves that distinction instead of smoothing it away.
Boundary: This table measures published real field of view only. It does not rank optical quality, sharpness, comfort, stability, brightness, or overall suitability. Those questions require different specifications, fit checks, or direct testing.
The practical takeaway is simple: check the exact 8x and 10x specification pages before assuming how much view you will give up. If two families both offer 8×42 and 10×42 models, their field changes can still be very different. That makes model-specific comparison more useful than a remembered rule of thumb. It also keeps this dataset in its proper lane instead of turning it into a general 8x versus 10x buying guide.
Add 12x only where the same family publishes it
Maven C.1 also publishes a 12×42 in the same family, so it provides a useful secondary check without expanding the primary sample into unrelated products. Its listed field is 262 feet at 1,000 yards, compared with 314 feet for the 10×42 and 341 feet for the 8×42. From 10x to 12x, the field drops another 52 feet, or about 16.6% of the 10x field. From 8x to 12x, the total reduction is 79 feet, or about 23.2% of the 8x field.
The interesting part is not that 12x is narrower, but that the steps are uneven inside one family. C.1 loses only about 7.9% from 8x to 10x, then about 16.6% from 10x to 12x. That is another reason not to treat magnification as a simple linear conversion for field width. A 2x increase in the printed magnification number does not, by itself, tell you how many feet of real field the optical design will give up.
Why magnification alone cannot predict field of view
Magnification and real field of view are related, but the finished binocular is an optical system rather than a one-number formula. Eyepiece design, internal optical choices, and the manufacturer’s target field can differ between families that share the same 8×42 or 10×42 label. The dataset makes that visible without needing to speculate about proprietary design details. If magnification alone fixed field width, the percentage change would be much more consistent across these four same-family pairs.
This is also why comparing only the first number on the binocular body can hide meaningful differences between models. Two 10×42 binoculars can have different real fields even though their magnification and objective diameter match, just as two 8×42 models can start from very different widths. The same caution applies to weight and dimensions, which can vary inside and across configurations, as shown in our binocular size and weight comparison. Specs work best as a group, with each number answering a narrower question rather than pretending one label explains the entire viewing experience.
What this dataset cannot tell you about edge quality, comfort, or the better magnification
A published 435-foot field is wider than a published 362-foot field, but that fact does not tell us how much of either view appears equally sharp from center to edge. It also does not tell us how the eyecups fit, whether the eye relief works for a particular glasses wearer, how the focus mechanism feels, or how steady a person can hold the binocular. Those questions require different evidence, and some require direct fit or controlled testing. I would not use this table to claim that the widest field is automatically the better binocular.
The dataset also does not settle the broader 8x versus 10x decision. Viewing distance, target movement, light, hand stability, weight tolerance, eye relief, and the need to find a subject quickly can all matter alongside field of view. A person comparing two exact models should verify those specifications separately rather than letting one column decide the purchase. The field numbers narrow one question well, which is more useful than stretching them into claims they cannot support.
The field of view check I would make before comparing 8x and 10x
Start with the two exact models, not a generic 8×42 and 10×42 assumption. Find the real or linear field of view on each official specification page, confirm that the unit and distance match, and calculate the absolute difference. Then divide that difference by the 8x field if you want the percentage change. This gives you a model-specific answer before you weigh field width against the rest of the decision.
Next, check whether the wider or narrower field actually matters for the way you expect to observe. A moving subject at moderate distance, a broad landscape scan, and a stationary distant target create different priorities, so field width should be considered with magnification, stability, eye relief, weight, and physical fit. If the exact 10x model still offers a field you consider adequate, a larger percentage loss elsewhere in the market is irrelevant to your choice. If field width is a priority, compare the published numbers directly and let the family-specific difference replace the shortcut.
- Confirm the exact model and magnification on the manufacturer page.
- Use real or linear field of view in matching units.
- Calculate the exact 8x to 10x difference for that family.
- Check eye relief, weight, fit, and stability separately before deciding.
- Do not infer sharpness or comfort from field width alone.
This check takes the comparison back to the question the specifications can answer cleanly. It avoids both extremes: assuming 10x barely changes the view, or assuming every 10x loses the same large percentage. The family page is more useful than either shortcut. Once that number is clear, the rest of the buying decision can be made on its own evidence.
Final Thoughts: compare the exact pair, not a fixed rule
Across these four same-family 8×42 and 10×42 pairs, every 10x model has the narrower published real field, but the size of the change varies substantially. The observed losses run from about 7.9% for Maven C.1 to about 17.4% for Maven B1.2. Nikon MONARCH M7 and Vortex Diamondback HD fall between those endpoints rather than creating a single universal percentage. That spread is the result worth carrying into the next comparison.
Use magnification as a starting label, then verify the field width of the exact models you are considering. After that, judge the difference against the viewing situation, eye relief, stability, weight, and physical fit that matter to you. A narrower 10x field may be an acceptable trade for one viewer and a meaningful limitation for another. The useful next step is model-specific comparison, not another rule of thumb.
FAQs
The questions below stay within what the published field data can answer. They separate the measured family differences from broader buying claims that would require more evidence. The answers use the same real field definition and model-specific logic as the main dataset. Where a conclusion depends on the exact binocular, the specification page remains the deciding reference.
Field of view is easy to oversimplify because the 8x and 10x labels look mathematically tidy. The four families here show why the final optical design still matters. Use these answers as checks, not as substitutes for comparing the models in front of you. A good shortcut should point back to the exact spec, not replace it.
🔭 Do 10x binoculars always have a narrower field of view than the 8x version?
In all four same-family 8×42 and 10×42 pairs in this dataset, the 10x version has the narrower published real field. That supports the pattern within this sample, but it is not a universal proof for every binocular ever made. Check the exact manufacturer specifications for the pair you are considering.
📏 How much field of view do you lose going from 8x to 10x?
In this sample, the loss ranges from about 7.9% to 17.4% relative to each family’s 8x field. The exact amount changes by design, so using one fixed percentage for all 8×42 and 10×42 binoculars would overstate what the data shows.
🧮 How do I calculate the percentage field of view change?
Subtract the 10x field from the 8x field, divide that result by the 8x field, then multiply by 100. Use matching units and compare models from the same family if you want the cleanest magnification-to-magnification comparison.
👓 Does a wider field of view mean a binocular will be more comfortable with glasses?
No. Field width does not establish eyeglass fit or viewing comfort by itself. Check the exact model’s eye relief, eyecup design, and your own physical fit separately.
🌲 Is a wider field of view automatically better?
No. A wider real field can show more scene at once, but this dataset does not measure edge quality, sharpness, stability, weight, or fit. Decide how much field width matters only after matching it to your viewing conditions.
🔢 Can I predict field of view from magnification alone?
No. The four same-family comparisons show different percentage changes despite all moving from 8×42 to 10×42. Magnification matters, but the exact optical design determines the published field you actually get.
References and Sources
The primary dataset uses manufacturer-published specifications for the exact families compared above. I used linear field of view in feet at 1,000 yards wherever the manufacturer supplied it directly. The same pages also support the listed magnification, objective diameter, dimensions, and weight relationships used to document each pair. No retailer field figures were substituted for the core calculations.
Maven publishes both magnifications on one family page for B1.2 and C.1, while Nikon and Vortex publish separate product pages for their 8×42 and 10×42 models. Linking each relevant official page keeps the numbers auditable without adding unrelated external references. These sources support the specification dataset, not claims about subjective comfort or optical quality. The calculations in the article are derived directly from the listed field values.
- Maven B1.2 specifications: supports the 420 and 347 ft/1000 yd field figures plus shared dimensions and weight.
- Maven C.1 specifications: supports the 341, 314, and 262 ft/1000 yd field figures plus dimensions and weights.
- Nikon MONARCH M7 8×42 specifications: supports the 435 ft/1000 yd field figure, size, and weight.
- Nikon MONARCH M7 10×42 specifications: supports the 362 ft/1000 yd field figure, size, and weight.
- Vortex Diamondback HD 8×42 specifications: supports the 393 ft/1000 yd field figure, dimensions, and weight.
- Vortex Diamondback HD 10×42 specifications: supports the 330 ft/1000 yd field figure, dimensions, and weight.